検索

この投稿は古いことに注意してください。
お知らせ
· 2022年2月28日

[Video] Securing FHIR Applications with OAuth 2.0 (Part 1)

Hi Community, 

Join us for this introduction to the terminology and workflow of using OAuth 2.0 with an HL7 FHIR server:

⏯ Securing FHIR Applications with OAuth 2.0 (Part 1)


🗣 Presenter: @Patrick Jamieson, Product Manager IRIS for Health, InterSystems

Enjoy watching on InterSystems Developers YouTube channel and stay tuned!  

ディスカッション (0)1
続けるにはログインするか新規登録を行ってください
質問
· 2022年2月25日

Optimal Apache/Web Gateway settings

After what is seemed was weeks, I finally got SSL/TLS enabled on both Apache Web Server and IRIS using the Web Gateway. However while we can now use HTTPS to connect to our Development instance of IRIS, I am running into several errors when I have others try to access the Management Portal via HTTPS.

We are seeing...

  • "Unexpected status code, unable to process Hyper Event: Internal Server Error (500)"
  • Server Unavailable

Does anyone have a Optimal settings list that I need to set for Apache/Web Gateway https? I am assuming the errors listed above are some kind of time out or settings somewhere.

Thanks

Scott Roth

6 Comments
ディスカッション (6)3
続けるにはログインするか新規登録を行ってください
質問
· 2022年2月25日

Separating Code, and Data databases in Installer Manifest using a containerized IRIS and durable %SYS feature

Hello,

The title says it all. I’m building an IRIS image with docker-compose using a separate Dockerfile. Pretty straightforward procedure: I import a Installer script inside the container containing a Installer Manifest I defined. Within the manifest, I create a namespace with code and data databases in separate locations. My intention is to keep the code database inside the container, so whenever I build the container, the imported code is replaced. The data, however, should be persistent.

Without setting the ISC_DATA_DIRECTORY environment variable, I can see from the Management Portal, after I built and started the container, that the databases are in separate locations as expected. For clarity’s sake, I defined that the code database (Namespace-Code) is in /code/NameSpace-Code/ directory and the Data is in /usr/irisssys/mgr/Namespace-Data

If I define the ISC_DATA_DIRECTORY environment variable and mount a corresponding docker volume, I would expect the Data db to be moved to the persistent volume and the Code db to be inside the /code folder withing the container. However, when doing so, for whatever reason, the Code db is moved to the persistent volume as well. When I checked the database locations from the Management Portal after enabling the durable %SYS feature, suddenly the Code database location was in /durable/irissys/db/code/NameSpace-Code/ and the data db was in /durable/irissys/db/usr/irisssys/mgr/Namespace-Data folder. It seems like the ISC_DATA_DIRECTORY variable value is appended in the beginning of the db path.

Is there anything I can do to prevent the Code db to be moved to the persistent volume and instead just move the Data db there instead? The Data db path is also a bit weird. It would be great if the Data db would be within /durable/irissys/mgr folder.

Any idea if I’m doing something fundamentally wrong with this?

If needed, I can copy and paste some docker configurations I use, even though they are pretty much copy and pasted from examples provided by InterSystems.

Just to clarify, everything is working great, but I just need the Code database to live within the container instead of being persistent.

Thanks for any insight and/or examples!

Kari

6 Comments
ディスカッション (6)2
続けるにはログインするか新規登録を行ってください
ディスカッション (3)1
続けるにはログインするか新規登録を行ってください
記事
· 2022年2月22日 5m read

Building IRIS Responsive dashboard with Python Flask Web Framework

Hi Community,

This post is a introduction of my openexchange iris-python-apps application. Build by using Embedded Python and Python Flask Web Framework
Application also demonstrates some of the Python functionalities like Data Science, Data Plotting, Data Visualization and QR Code generation.

image


 Features

  •  Responsive bootstrap IRIS Dashboard

  •  View dashboard details along with interoperability events log and messages.

  •  Use of Python plotting from IRIS

  •  Use of Jupyter Notebook

  •  Introduction to Data Science, Data Plotting and Data Visualization.

  •  QR Code generator from python.

Responsive bootstrap IRIS Dashboard by using embedded python

Below is the code of user defined function get_dashboard_stats() to get data from SYS.Stats.Dashboard IRIS class by using embedded python :

   import iris   
   // make sure to connect with %SYS namespace by using custom object script function
    iris.cls("Embedded.Utils").SetNameSpace("%SYS")
    ref = iris.cls("SYS.Stats.Dashboard").Sample()
    last_backup = ref.LastBackup
    #check if variable is empty
    if not last_backup:
        last_backup = "Never"
    #content data dictionary to store data to be used in HTML page
    content = {
        'ApplicationErrors':ref.ApplicationErrors,
        'CSPSessions':ref.CSPSessions,
        'CacheEfficiency':ref.CacheEfficiency,
        'DatabaseSpace' : ref.DatabaseSpace,
        'DiskReads' : ref.DiskReads,
        'DiskWrites' : ref.DiskWrites,
        'ECPAppServer' : ref.ECPAppServer,
        'ECPAppSrvRate' : ref.ECPAppSrvRate,
        'ECPDataServer' : ref.ECPDataServer,
        'ECPDataSrvRate' : ref.ECPDataSrvRate,
        'GloRefs' : ref.GloRefs,
        'GloRefsPerSec' : ref.GloRefsPerSec,
        'GloSets' : ref.GloSets,
        'JournalEntries' : ref.JournalEntries,
        'JournalSpace' : ref.JournalSpace,
        'JournalStatus' : ref.JournalStatus,
        'LastBackup' : last_backup,
        'LicenseCurrent' : ref.LicenseCurrent,
        'LicenseCurrentPct' : ref.LicenseCurrentPct,
        'LicenseHigh' : ref.LicenseHigh,
        'LicenseHighPct' : ref.LicenseHighPct,
        'LicenseLimit' : ref.LicenseLimit,
        'LicenseType' : ref.LicenseType,
        'LockTable' : ref.LockTable,
        'LogicalReads' : ref.LogicalReads,
        'Processes' : ref.Processes,
        'RouRefs' : ref.RouRefs,
        'SeriousAlerts' : ref.SeriousAlerts,
        'ShadowServer' : ref.ShadowServer,
        'ShadowSource' : ref.ShadowSource,
        'SystemUpTime' : ref.SystemUpTime,
        'WriteDaemon' :  ref.WriteDaemon,
        'tot_pro'   : tot_pro,
        'tot_msg'   : tot_msg,
        'tot_usr'   : tot_usr,
        'tot_apps'  : tot_apps,
        'tot_ev' : tot_ev,
        'tot_ev_assert' : tot_ev_assert,
        'tot_ev_error' : tot_ev_error,
        'tot_ev_warning' : tot_ev_warning,
        'tot_ev_info' : tot_ev_info,
        'tot_ev_trace' : tot_ev_trace,
        'tot_ev_alert' : tot_ev_alert
        }
    return content


Below is the main python code (app.py) to call get_dashboard_stats() user defined function to get deta, render index.html page and pass content data to it:

@app.route("/")
 def index():
    #get dashboard data in dictionary variable
    content = util.get_dashboard_stats()
    return render_template('index.html', content = content)


index.html use content dictionary variable to display related data. e.g {{ content.CSPSessions }} is used to display CSP Sessions:

<div class="row">
          <div class="col-lg-2 col-6">
            <!-- small box -->
            <div class="small-box bg-info">
              <div class="inner">
                <h3>{{ content.CSPSessions }}</h3>
                <p>CSP Sessions</p>
              </div>
              <div class="icon">
                <i class="ion ion-ios-photos"></i>
              </div>
              <a href="/processes" class="small-box-footer">View Details <i class="fas fa-arrow-circle-right"></i></a>
            </div>
 </div>


From dashboard we can also view details of running processes, messages, security users, applications and event logs by using iris.sql.exec() functionality.
image

Application also display plotting in HTML by using python matplotlib library:

image

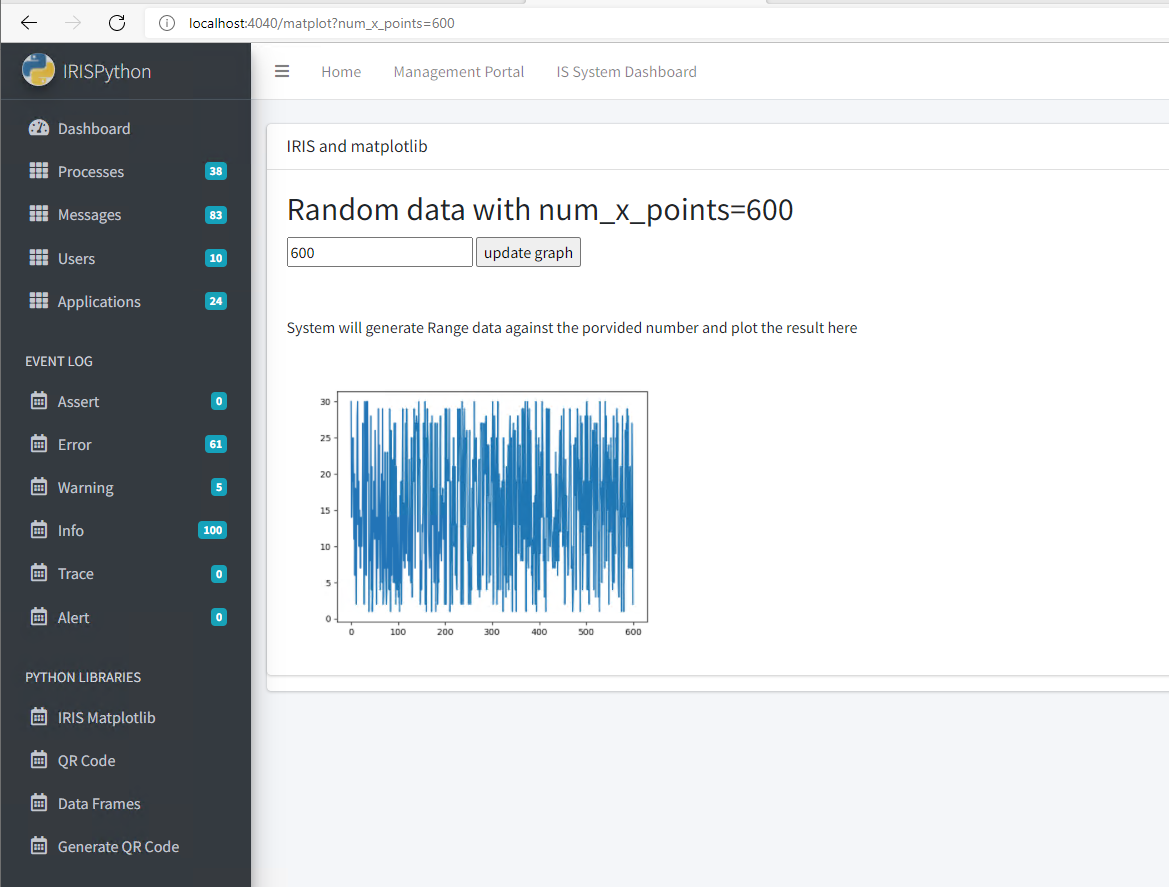
Below is the python code to display ploting in html:

app.route("/matplot")
def matplot():
    #Returns html with the img tag for your plot.
    content = util.get_sidebar_stats()
    num_x_points = int(request.args.get("num_x_points", 50))
    return render_template('matplot.html', content = content, num_x_points = num_x_points)  
@app.route("/matplot-as-image-<int:num_x_points>.png")
def plot_png(num_x_points=50):
    # renders the plot on the fly.
    fig = Figure()
    axis = fig.add_subplot(1, 1, 1)
    x_points = range(num_x_points)
    axis.plot(x_points, [random.randint(1, 30) for x in x_points])
    output = io.BytesIO()
    FigureCanvasAgg(fig).print_png(output)
    return Response(output.getvalue(), mimetype="image/png")

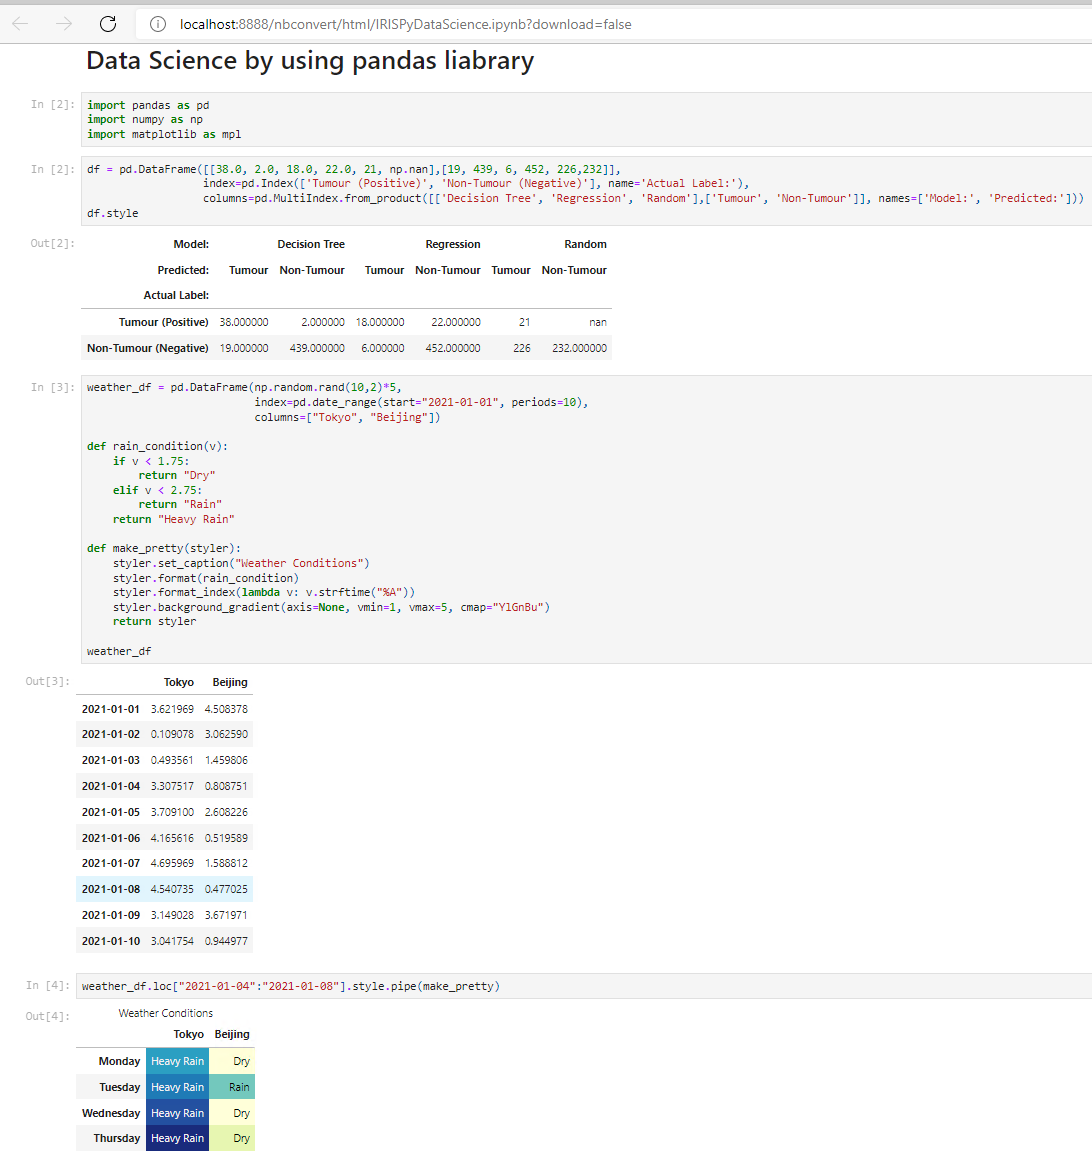
Introduction to Data Science, Data Plotting, Data Visualization and generation of QR code by using Jupyter Notebook

image


image
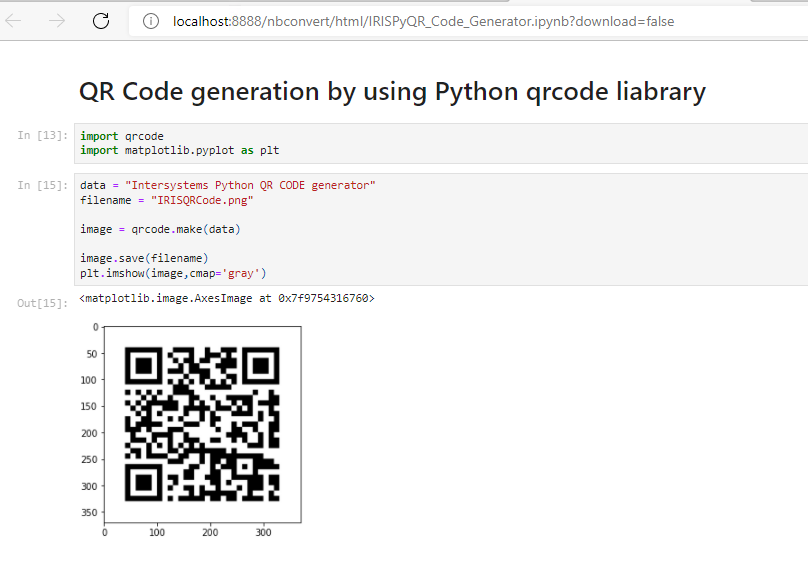
QR Code generation with Python


Thanks

1 Comment
ディスカッション (1)2
続けるにはログインするか新規登録を行ってください