これは InterSystems FAQ サイトの記事です。
こちらの記事では、「IRISでシャドウイングの代わりにミラーリングを構成する方法」を紹介しました。
今回は、「プログラムでシャドウイングの代わりにミラーリングを構成する方法(Windows版)」を紹介します。
【今回のサンプル・ミラー構成について】
| 正サーバ(ミラー・プライマリ) | 副サーバ(ミラー・非同期) | |
| ミラー名 | MIRRORSET | MIRRORSET |
| ミラーメンバ名 | MACHINEA | MACHINEC |
| IPアドレス | 35.77.84.159 | 54.248.39.237 |
では、ミラーの構成手順をご紹介します。手順は以下になります。
<ミラーリングのプライマリ設定> // MACHINEA(正サーバ)
1. ISCAgentの自動起動設定および起動 ※Windowsコマンドプロンプトで実行
C:\Users\Administrator>sc config ISCAgent start=auto
C:\Users\Administrator>sc start ISCAgent
2. [システム管理] > [構成] > [ミラーサービスの有効化] ※IRISターミナルで実行
zn "%SYS"
set status=##class(Security.Services).Get("%Service_Mirror", .svcProps)
set svcProps("Enabled") = 1
set status=##class(Security.Services).Modify("%Service_Mirror", .svcProps)
3. [システム管理] > [構成] > [ミラーの作成] ※IRISターミナルで実行
zn "%SYS"
set MirrorSetName="MIRRORSET"
set SystemName = "MIRRORA"     // 任意で設定。設定しない場合、既定で$sysytem 変数の内容を利用(例:<デバイス名>/IRIS)
set MirrorInfo("UseSSL") = 0
set MirrorInfo("ECPAddress") = "xxx.xxx.xxx.xxx"      // this is the SuperServer Address, default value is result of $System.INetInfo.LocalHostName().
set sc = ##class(SYS.Mirror).CreateNewMirrorSet(MirrorSetName, SystemName, .MirrorInfo)
write $system.Mirror.GetMemberType()
// (出力) Failover
write $system.Mirror.GetStatus()
// (出力) PRIMARY、TRANSITIONの場合は少し待って再度実行
4. ローカルデータベースの作成(ミラー属性の追加) ※IRISターミナルで実行
zn "%SYS"
/// ローカルデータベースの作成
Set Directory="c:\intersystems\iris\mgr\mirrordb\"
Set x=$ZF(-100, "/shell", "mkdir", Directory)
Set db=##Class(SYS.Database).%New()
Set db.Directory=Directory
Set status=db.%Save()
Set DBName="MIRRORDB"
Set status=##class(Config.Configuration).AddDatabase(DBName,Directory)
Set NSName=DBName
Set status=##class(Config.Configuration).AddNamespace(NSName,DBName)

/// ミラー属性の追加(プライマリフェイルオーバーメンバのみ)
set status=##class(SYS.Mirror).AddDatabase(Directory)
set db=##Class(SYS.Database).%OpenId(Directory)
write db.Mirrored
// (出力) 1           ; Mirror DB の場合1
kill
<ミラーリングのDR非同期設定> // MACHINEC(副サーバ)
1. ISCAgentの自動起動設定および起動 ※Windowsコマンドプロンプトで実行
C:\Users\Administrator>sc config ISCAgent start=auto
C:\Users\Administrator>sc start ISCAgent
2. ミラーサービスの有効化
*[システム管理] > [構成] > [ミラーサービスの有効化] ※IRISターミナルで実行
zn "%SYS"
set status=##class(Security.Services).Get("%Service_Mirror", .svcProps)
set svcProps("Enabled") = 1
set status=##class(Security.Services).Modify("%Service_Mirror", .svcProps)
3. 非同期としてミラーに参加
*[システム管理] > [構成] > [非同期として参加] ※IRISターミナルで実行
zn "%SYS"
set MirrorSetName="MIRRORSET"
set InstanceName="IRIS"            // primary instanace name
set AgentAddress="xxx.xxx.xxx.xxx" // primary member DNS name or IPaddress
set AsyncMemberType=0              // DR:0, Reporting R only:1, Reporting R/W:2
set SystemName = "MIRRORC"         // 任意で設定。設定しない場合、既定で$sysytem 変数の内容を利用
set LocalInfo("ECPAddress") = "yyy.yyy.yyy.yyy" // this is the SuperServer Address, default value is result of $System.INetInfo.LocalHostName().
set status=##class(SYS.Mirror).JoinMirrorAsAsyncMember(MirrorSetName,SystemName  ,InstanceName,AgentAddress,,AsyncMemberType,.LocalInfo)
write $system.Mirror.GetMemberType()
// (出力) Disaster Recovery
write $system.Mirror.GetStatus()
// (出力) CONNECTED、TRANSITIONの場合は少し待って再度実行
4. ミラーデータベースの準備
非同期の副サーバ:MACHINEC に、正サーバ:MACHINEA のバックアップファイルをリストアします。
【補足】
データベースファイル(IRIS.DAT)のコピーによるバックアップの場合は(=正サーバで Backup.Generalクラスの ExternalFreeze()/ExternalThaw() を利用してバックアップを取っている場合)、非同期データベースをディスマンとした状態でデータベースファイル(IRIS.DAT)を置換します。
※ローカルデータベースの作成手順は、正サーバ:MACHINEAと同じです。
(4の「ローカルデータベースの作成」、ミラー属性の追加 以外を行います)
※外部/オンラインバックアップ・リストアについては、以下の記事で詳細手順を説明していますので、参考になさってください。
・外部バックアップについて
・オンラインバックアップについて
5. ミラーモニターでのジャーナルの有効化、キャッチアップ ※IRISターミナルで実行
zn "%SYS"
set Directory="c:\intersystems\iris\mgr\mirrordb\"
set status=##class(SYS.Mirror).ActivateMirroredDatabase(Directory)  // 有効化
set db=##class(SYS.Database).%OpenId(Directory)
set sfn= db.SFN  // sfn system file number データベーステーブル(内部情報)内の番号
kill db
set status=##class(SYS.Mirror).CatchupDB($lb(sfn))  // キャッチアップ
write status     // 1 でキャッチアップ成功。それ以外の場合は write $SYSTEM.Status.DisplayError(status) でエラーの内容を確認
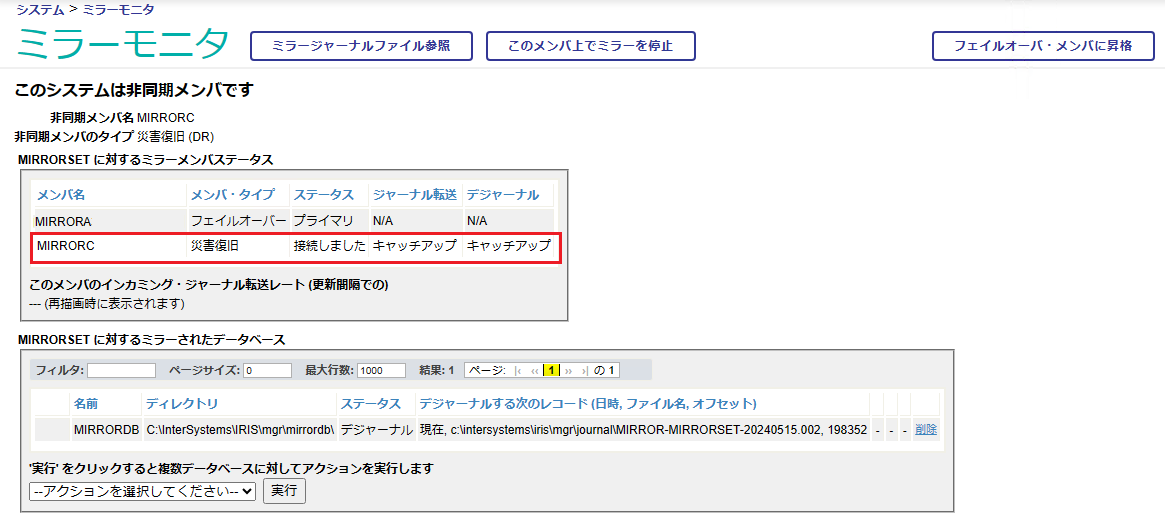
6. 管理ポータルで、キャッチアップしたことを確認(こちらで構成は終了です)
*[システムオペレーション] > [ミラーモニタ]
各種設定の詳細は以下のドキュメントをご覧ください。
Security.Services
SYS.Mirror
$SYSTEM.Mirror
 【ご参考】
【ご参考】
Cache Mirroring 101:簡単なガイドとよくある質問
ミラーリングの機能について
ミラージャーナルファイルの削除のタイミングと要件
IRISでシャドウイングの代わりにミラーリングを構成する方法
 Open Exchange