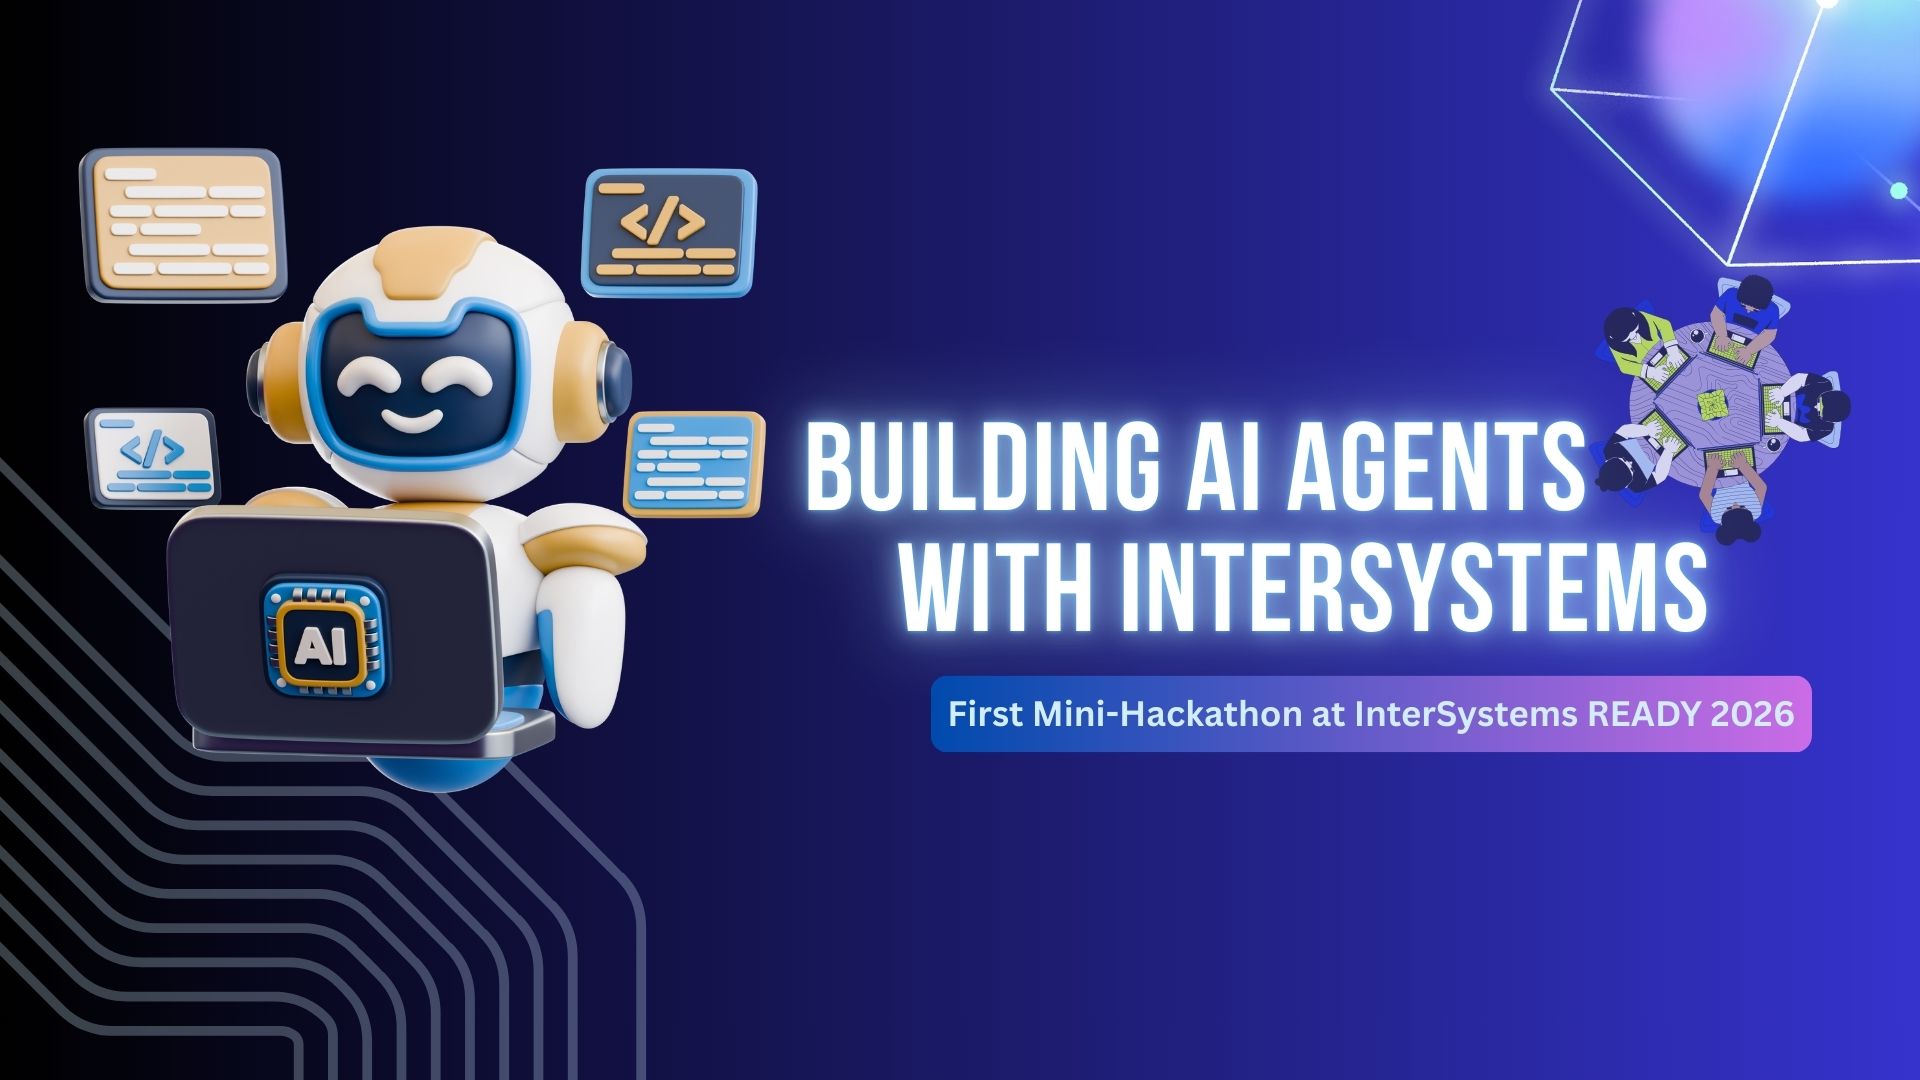
Encontrar

記事
· 2025年12月2日 1m read

Ejemplo ECP "Reloaded" - Despliegue de varias instancias de IRIS en arquitectura ECP

Hace ya un tiempo hice un pequeño ejemplo para poder desplegar rápidamente utilizando Docker instancias de InterSystems IRIS conectadas vía ECP. Ha pasado el tiempo y, como todo, necesitaba algo de chapa y pintura... 

Así que lo he adaptado para que funcione con la última versión de IRIS (a día de hoy 2025.3) que, entre otras cosas, ya no despliega por defecto un servidor web, lo que no es un tema menor... no es problemático, pero hay que tenerlo en cuenta.

He simplificado los docker files y actualizado los docker-compose.yml y he añadido al despliegue servidores web específicos para administrar las instancias que queramos. El resto de funcionalidad, aplicaciones de ejemplo, etc... sigue igual. Encontrarás toda la información Open Exchange y en el repositorio de GitHub.

Happy coding!

ディスカッション (0)1
続けるにはログインするか新規登録を行ってください
お知らせ
· 2025年12月1日

最新消息:"IntegratedML Custom Models"抢先体验计划——在SQL中部署您的Python机器学习模型

我们非常高兴地宣布, IntegratedML Custom Models(集成式机器学习自定义模型)抢先体验计划即将开启,这是 IRIS 2026.1 版本中即将推出的一项强大新功能!

这是什么?

IntegratedML Custom Model扩展了现有的IntegratedML/AutoML(集成式机器学习/自动化机器学习)功能,支持您直接在 SQL 查询中部署自己的自定义 Python 机器学习模型。IntegratedML AutoML功能提供自动化机器学习服务,而Custom Model(自定义模型)则赋予您完全的控制权——自定义预处理、任意与 scikit-learn 兼容的模型,以及 Prophet 或 LightGBM 等第三方库——所有操作均在数据库内执行,无需数据移动。

ディスカッション (0)1
続けるにはログインするか新規登録を行ってください
お知らせ
· 2025年12月1日

Winner of the "Improving the Initial Developer Experience" Sweepstakes

Hi Community!

Thank you to everyone who participated in the "Improving the Initial Developer Experience" sweepstakes! Your feedback is invaluable in making InterSystems products better, and we will use your ideas to improve our offerings. Now, it's time to announce the winner - watch the video to see the sweepstake drawing:

And the winner of the sweepstakes is @Pietro Di Leo. Congratulations! We will get in touch soon to deliver your prize: Acepods Pro – Earbuds with a Digital Display.

Stay tuned for more opportunities to engage and contribute!

2 Comments
ディスカッション (2)4
続けるにはログインするか新規登録を行ってください
質問
· 2025年12月1日

Adding a button to %CSP.Page to execute ResendDuplicatedMessage

Within Provider Data Management, I wanted a way to capture the Code Table mapping errors thrown by HSPD.MDM.FlowControl.Process into a Workflow Task for someone to work. However, because HSPD.MDM.FlowControl.Process can get overwritten during the upgrade process, I cloned it into another Business Process so we can use Workflow Tasks to troubleshoot mapping errors.

This new Business Process will send the Errors to the Workflow Task Operation, but because it is not the HSPD.MDM.FlowControl.Process resubmitting the message will not resubmit the record to be processed through HSPD.MDM.FlowControl.Process.

So, using a Workflow Template, I am attempting to create another way to Resend the originating message using 

##class(Ens.MessageHeader).ResendDuplicatedMessage(MsgHdrID)

If I add the button to the  OSU.ExternalFiles.Forms.workFlowTaskTemplate, and tell it to use javascript to call the Class Method Resend, when the button is clicked its not resending the message like it should.

Has anyone added a Button to a %CSP.Page to have it do something similar?

Class OSU.ExternalFiles.Forms.workFlowTaskTemplate Extends %CSP.Page
{

ClassMethod OnPage() As %Status
{
    &html<
        <table>
            <tr>
                <td>
                Message Source: #(%task.%FormValues.GetAt("MsgSource"))# <br/>
                Provider: #(%task.%FormValues.GetAt("Provider"))# <br/>
                NPI: #(%task.%FormValues.GetAt("NPI"))# <br/>
                Error: #(%task.%FormValues.GetAt("ErrorMsg"))# <br/>
                <a href="EnsPortal.VisualTrace.zen?SESSIONID=#(%task.%FormValues.GetAt("MsgHdrID"))#" target="_blank">View Message Trace</a><br/><br/>
                <button type='button' onclick='executeCacheCode();'>Resend Message</button>
                <script type="text/javascript">
    			 	function resendMessage() {
	    			 	const response = #server(OSU.ExternalFiles.Forms.workFlowTaskTemplate.ResendMessage(%task.%FormValues.GetAt("MsgHdrID")))#;
	    			 	alert('Result: ' + response);
    			 	}
	    		</script>
                </td>
            </tr>
        </table>
    >
	Quit $$$OK
}

ClassMethod ResendMessage(MsgHdrID As %String) As %String
{
	try{
        Set tSC = ##class(Ens.MessageHeader).ResendDuplicatedMessage(MsgHdrID)
       	IF $$$ISERR(tSC){throw tSC}
	}
	Catch exception {
		Set tSC = exception.AsStatus()
		W "ERROR:",tSC,!
	}
	QUIT $$$OK
}

/// Location and Revision of this file in Perforce (Auto-updating)
Parameter SrcVer = "$Id$";

}
1 Comment
ディスカッション (1)2
続けるにはログインするか新規登録を行ってください
記事
· 2025年12月1日 5m read

Debugging 101: Your First Breakpoint and Tracing Variables in VS Code

In this article, we will discuss all the debugging tools included in the Microsoft Visual Studio Code IDE.

What will be covered:

  • Breakpoints
  • Watch window
  • Call Stack

Let's start by learning about debugging requirements!

Prerequisites

There are two plugins (extensions) for debugging ObjectScript:

The first is part of the InterSystems ObjectScript Extension Pack. The second is Serenji, a standalone plugin that provides an editor, file manager, and debugging functionality. Both plugins can be installed from the plugin store. To activate key functionality, Serenji requires a license. For this article, we'll use the InterSystems ObjectScript Extension Pack to reduce the learning curve. After you've mastered the basics, you can consider purchasing a paid license for Serenji.

You need: 

  1. The latest version of Microsoft Visual Studio Code IDE 
  2. Installed InterSystems ObjectScript Extension Pack plugin (after installing Visual Studio Code)
  3. InterSystems IRIS instance. You can choose between Docker version or installation kit. (you have to be registered within Developer Community ecosystem)

How to connect your IRIS to Microsoft Visual Studio Code IDE you can read here.


Setting up the debug function


Typically, the configuration file is generated automatically after debugging begins. It will look like this:
 

{
    "configurations": [
       
    {
        "type": "objectscript",
        "request": "launch",
        "name": "ObjectScript Run current routine",
        "program": "${file}"
    }
    ]
 
}


Where type is the language of the code being debugged, request is the debugging start option (launch - starts and executes the code or attach - attaches to the already running code), name is the debugging identifier, program is the name of the class and method being debugged (in this configuration, an open file is picked up). 

Breakpoint

Any program code is executed from top to bottom, line by line. When debugging, it's important to understand the program's state at any given moment, including the values ​​of local and global variables, the opening and closing of files, web connections, and so on.

Breakpoint is a debugging tool that allows you to pause program execution at a specific line to pinpoint unwanted changes in the program's state. Getting started with debugging in Visual Studio Code is very simple. Let's say we have the following code:
 

Class Test.MyFile Extends %RegisteredObject
{

ClassMethod TestVar() As %Integer
{
    set randomNum = $RANDOM(10)
    return randomNum
}

ClassMethod MyMethod() As %Integer
{
    set randomNum = ..TestVar()
    set numVar = 2
    set numDivision = randomNum / numVar

    return numDivision
}
}

We need to understand the value stored in the randomNum variable in the MyMethod() method. It is returned by the TestVar() method. We set a breakpoint before performing the arithmetic operation with this variable on line 15 and click the Debug button. If you don't set a breakpoint, debugging will simply execute the code without outputting anything to the console.

We can see the value of a given variable immediately after starting debugging! Very convenient. Next, we can step through the entire program line by line by pressing the Step into button or F11.


Great! Now we know the values ​​of the variables at every step of the code execution.

We can loop through variables within a loop in the same way. Let's take the following code:
 

Class Test.MyFile Extends %RegisteredObject
{

ClassMethod LoopMethod() As %List
{

    set objList = $LB("string", 1, {"name":1})
    for i=1:1:$LL(objList){
        set item = $LG(objList, i)
    }
    
    return objList
}

}

Let's set a breakpoint at the beginning of the method and start debugging. Then, using the “Step into” button on the debugging panel placed at the top of IDE, we move down the program and observe the values ​​assigned to the item variable. We also see the values ​​of all other variables within the program, including the iterator variable i, which in this case is equal to 2.

 
So, moving further along the loop, you can track what value will be assigned to the item variable for each step of the loop.

Watch window

We can also monitor a variable's state during debugging by adding it to watch. In watch mode, we can apply methods to a variable and measure its state in each iteration. For example, consider the following code:
 

Class Test.MyFile Extends %RegisteredObject
{

ClassMethod WatchAVariable() As %List
{
    set list = ""
    set randomNum = $RANDOM(100)
    for int=randomNum:randomNum:100000{
        set list = list _$LB(int)
    }

    return list
}
}

And we will write three methods for the list variable:

 
We want to keep track of the length of the list $LL(list), the last number added $LG(list, -1) and its square root $LG(list, -1) ** 0.5. We step inside the loop and get the first values:

 
By defining functions in the watch window, we can see detailed debugging information! Additionally, the variables window still displays the values ​​of the int iterator variables and the loop step. Very convenient!

Call stack window

Notice the “Call Stack” window at the very bottom. This window shows the order of function calls in your code. In our current state, we have two items: the loop and the assignment of variables WatchVariable+7 and WatchVariable+6, respectively. But everything here is pretty self-explanatory. Let's add some more logic:
 

Class Test.MyFile Extends %RegisteredObject
{

ClassMethod RandomlyChangeVar() As %Integer
{
    return $RANDOM(100)
}

ClassMethod WatchAVariable() As %List
{

    set list = ""
    set randomNum = $RANDOM(100)
    for int=randomNum:randomNum:100000{
        set list = list _$LB(int)
        if $LG(list, -1) ** 0.5 > 10{
            set int = int + ..RandomlyChangeVar()
        }
    }
    return list
}


}  


We've added a new method, RandomlyChangeVar(), which will change the next int variable if the square root of the last number is greater than 10. We loop until the state of the variables satisfies the logical condition (thats a GIF):


Note the values ​​of the square root function and the order of function calls in the call stack. As soon as the square root exceeded 10, the RandomlyChangeVar() function was immediately called! Furthermore, by measuring the length of the list, we were able to track how many loop steps it took to reach the desired logical condition. This makes it easy to track the order and conditions of calling multiple functions, no matter how complex the logic.

That's it! You now mastered VSCode ObjectScript Debugging.

In this article, we took a detailed look at the debugging feature in VSCode. We set our first breakpoint, tracked variable values.

2 Comments
ディスカッション (2)2
続けるにはログインするか新規登録を行ってください