IRIS BI開発者向けチュートリアルを試してみる(11)
はじめに
IRIS BIチュートリアル試してみたシリーズの11回目です。ついに今回が最終回になります。
最終回のトピックは「ピボット・テーブルおよびダッシュボードのエクスポートとパッケージ化」です。これまでに作成したピボットテーブルやダッシュボードをエクスポートして他の環境などに移送するためのテクニックを学びます。
では、早速はじめていきましょう。
ピボット・テーブルおよびダッシュボードのエクスポートとパッケージ化
フォルダマネージャ画面から操作します。管理ポータル画面から Analytics → 管理 → フォルダマネージャ と選択します。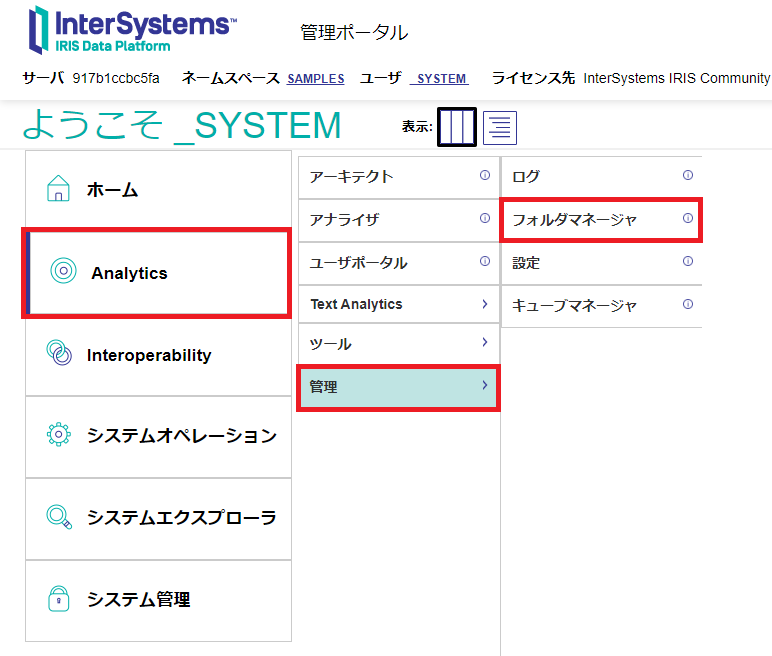
フォルダマネージャ画面が開き、作成済みのフォルダ、ピボットテーブル、ダッシュボードが一覧表示されます。これまでに作成してきた Tutorial フォルダと、その中のピボットテーブルやダッシュボードも存在します。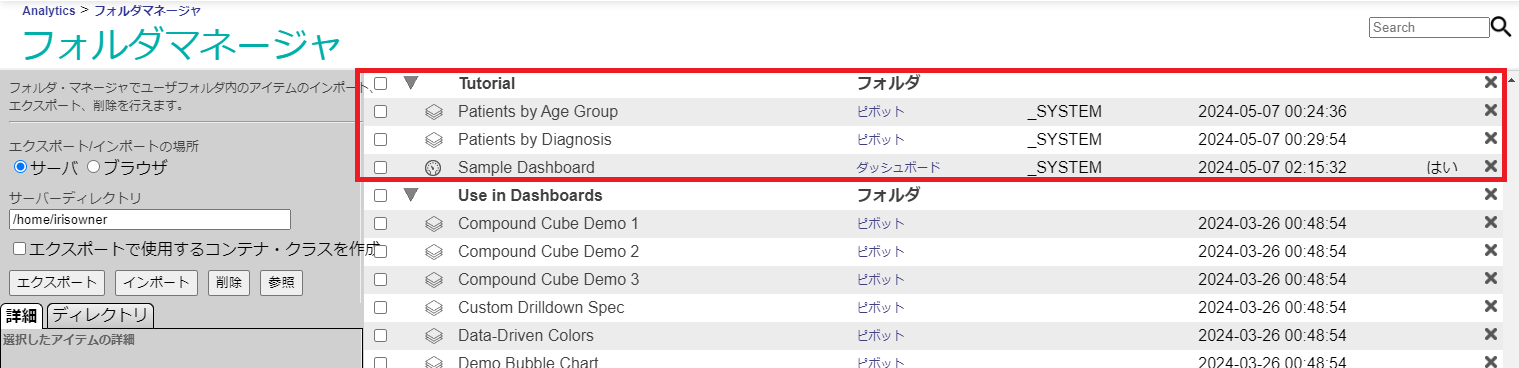
では、この一覧にある Sample Dashboard の左側にあるチェックボックスにチェックを付けます。画面左側の [詳細] の表示が変わります。
このダッシュボードで使用している2つのピボットテーブルが依存関係にあることが表示されます。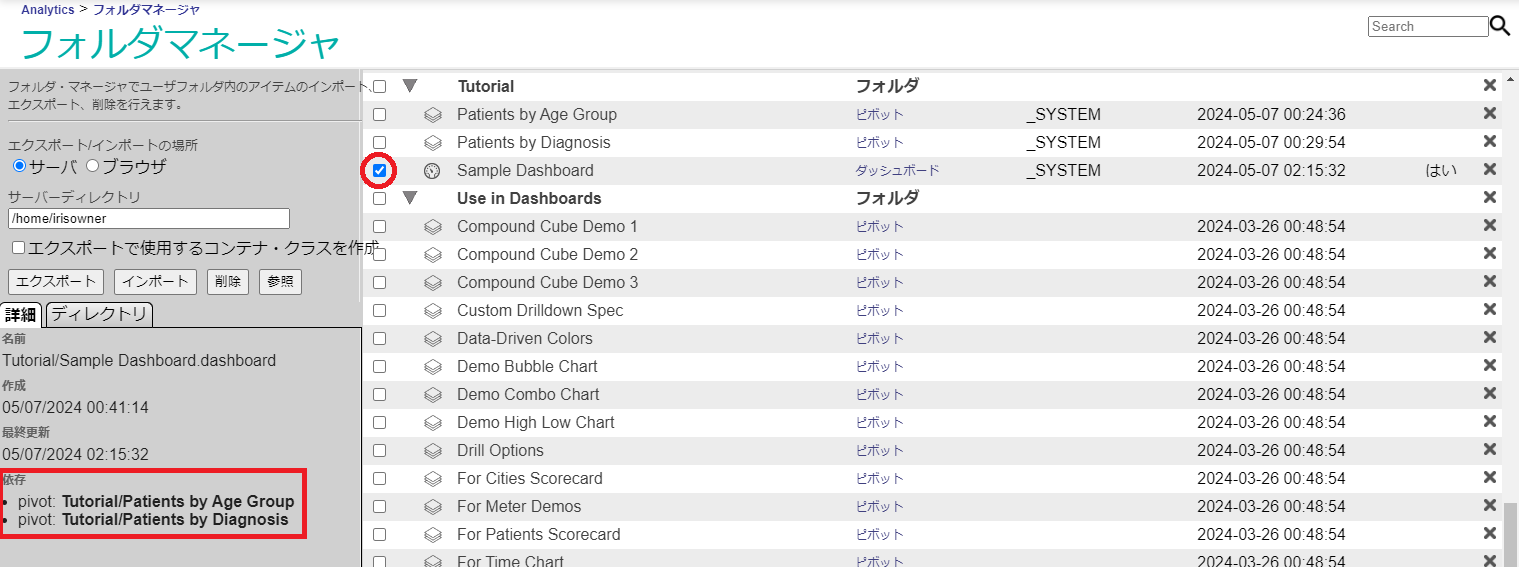
では、その2つのピボットテーブルにもチェックを付け、3つのアイテムが選択された状態にします。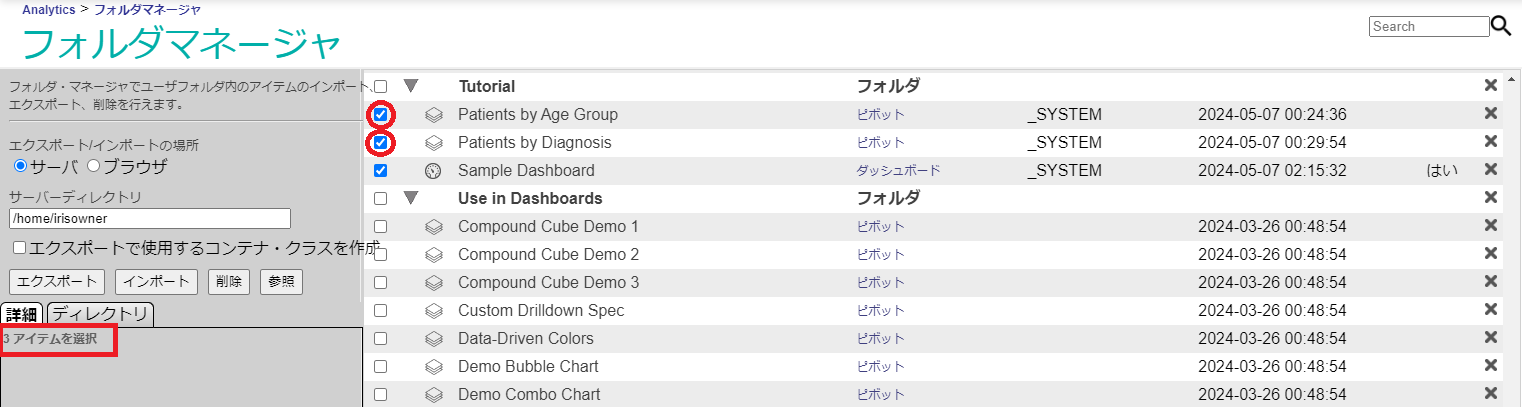
この状態で、画面左側の [サーバーディレクトリ] に書き込み可能なディレクトリを指定し、すぐ下の [エクスポート] ボタンをクリックします。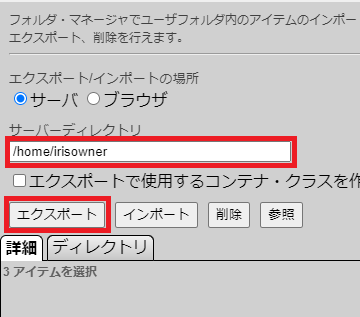
エクスポートが正常終了すれば、以下のダイアログが表示されます。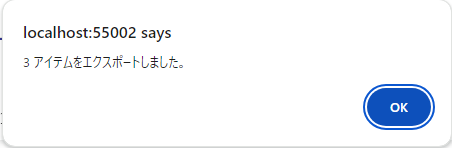
保存した先のディレクトリを確認しますと、3つのxmlファイルが作成されていることが分かります。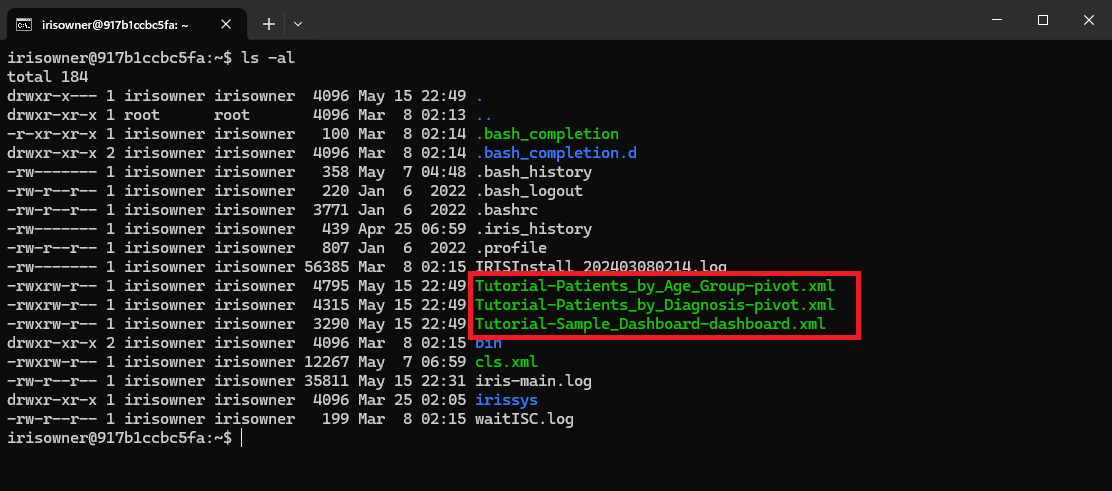
今しがたエクスポートしたxmlファイルをそのままインポートすることもできますが、これらをパッケージ化したクラスを作成します。
VSCode またはスタジオから、Tutorial.DashboardsAndPivots という新しいクラスを作成します。このクラスは %DeepSee.UserLibrary.Container を拡張する必要があります。 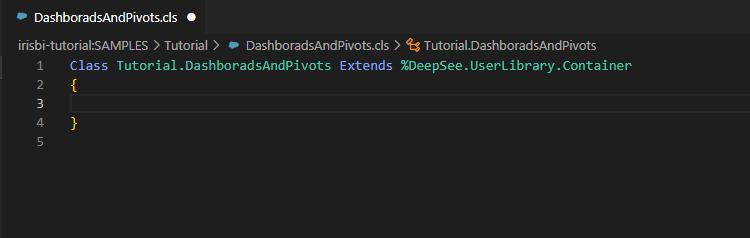
このクラスに、以下のように Contents という名前の XData ブロックを追加します。
XData Contents [ XMLNamespace = "http://www.intersystems.com/deepsee/library" ]
{
<items>
</items>
}
次に、先ほどエクスポートしたファイルから、ダッシュボードおよびピボットテーブルの定義を XData ブロックにコピーしていきます。
まず、ダッシュボードのエクスポートファイル Tutorial-Sample_Dashboard.xml を開きます。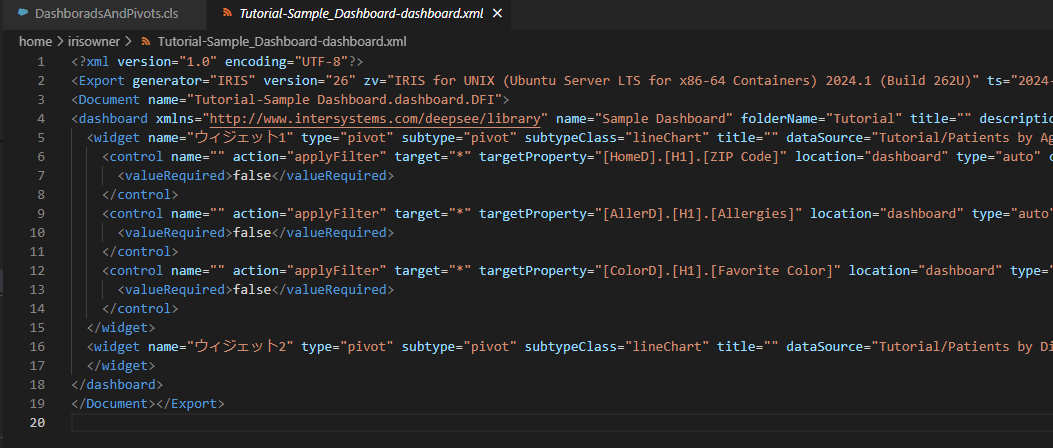
ここから、<dashboard> のセクションのところ(上図の4~18行目)をコピーし、作成しているクラスの <items> の中にペーストします。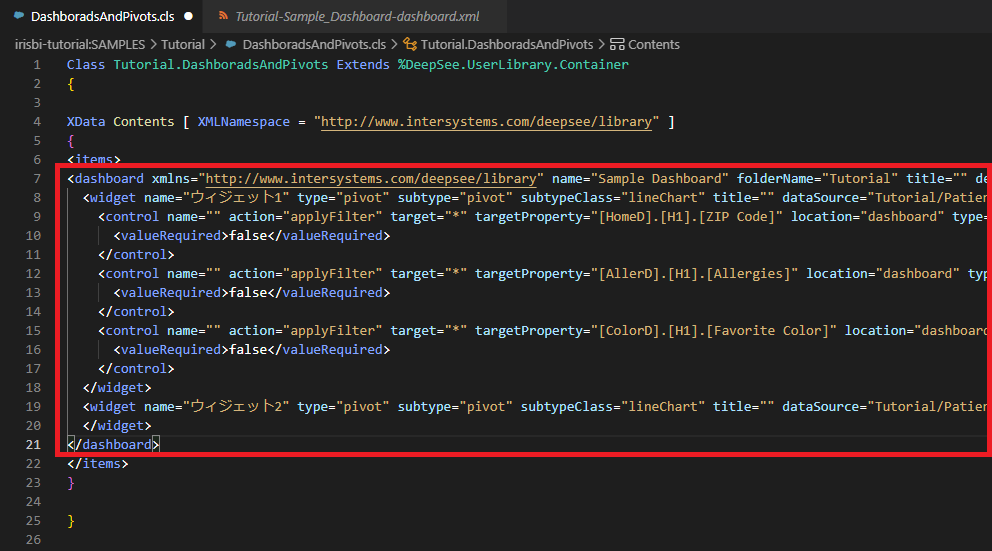
次に、Tutorial-Patients_by_Age_Group-pivot.xml を開きます。先ほどのダッシュボードのxmlに似ていますが、<dashboard> の代わりに <pivot> というセクションがあります。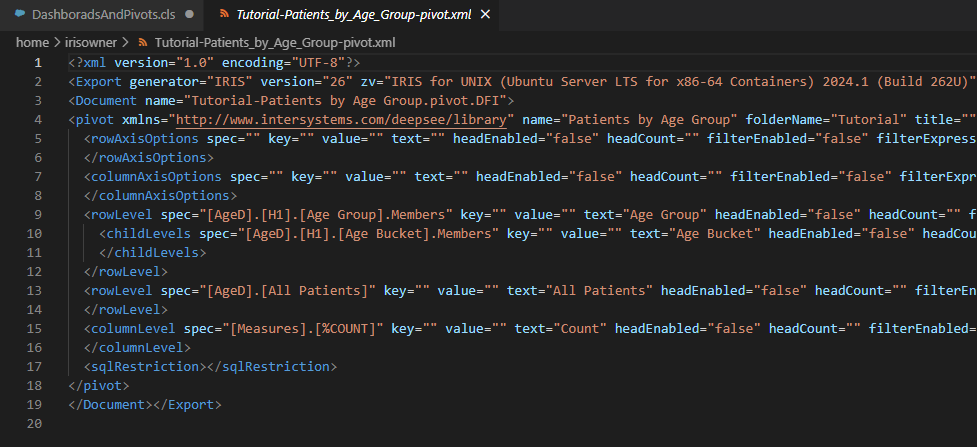
この <pivot> セクションのところを、先ほどと同様にコピーし、クラスファイルの <items> の中にペーストします。
位置は <dashboard> の前でも後ろでも構いませんが、混ざらないように注意してください。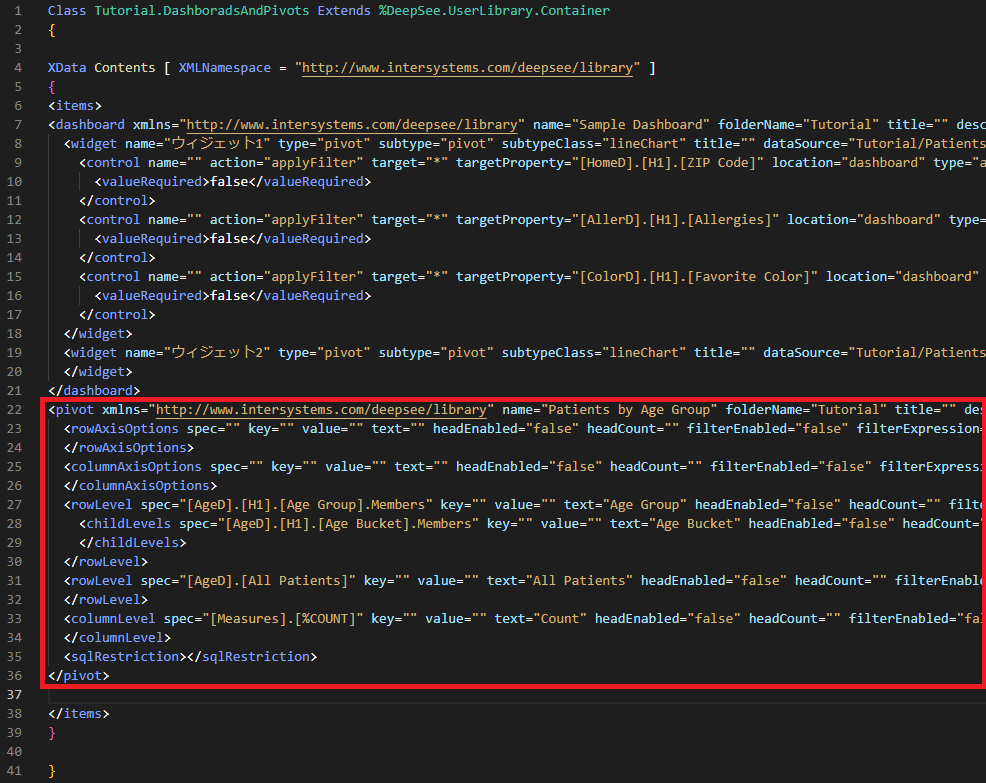
最後の1つ、Tutorial-Patients_by_Diagnosis-pivot.xml も同様に <pivot> セクションをコピー&ペーストします。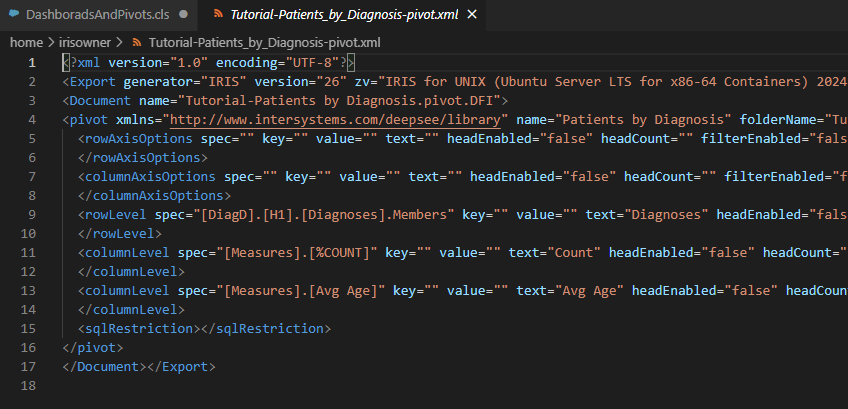
クラス定義は以下のようになります。ここまでできたら、クラス定義を保存してください。ただし、まだコンパイルは行わないでください。
Class Tutorial.DashboradsAndPivots Extends %DeepSee.UserLibrary.Container
{
XData Contents [ XMLNamespace = "http://www.intersystems.com/deepsee/library" ]
{
<items>
<dashboard xmlns="http://www.intersystems.com/deepsee/library" name="Sample Dashboard" folderName="Tutorial" title="" description="" keywords="" owner="" shared="true" public="true" locked="false" resource="" timeCreated="2024-05-07T00:41:14.04Z" createdBy="_SYSTEM" category="" bookCover="" lastAccessed="2024-05-07T02:15:32Z" scheme="" worklistCount="2" snapTo="true" snapGrid="true" gridRows="10" gridCols="10" canResize="true" canModify="true" showTitleBar="true" titleBarOpacity="" titleBarColor="" selectedTitleBarOpacity="" selectedTitleBarColor="" titleBarTextColor="" selectedTitleBarTextColor="" titleBarFont="" companyName="" companyLogo="" companyStyle="" backgroundColor="white" backgroundImage="none" backgroundRepeat="no-repeat" backgroundSize="100% 100%" backgroundOpacity="1" widgetBorders="1px solid #F0F0F0" widgetBordersSwitch="edit" widgetBordersColor="#F0F0F0" widgetBordersStyle="solid" widgetBordersWidth="1" widgetBordersToggle="true">
<widget name="ウィジェット1" type="pivot" subtype="pivot" subtypeClass="lineChart" title="" dataSource="Tutorial/Patients by Age Group.pivot" dataLink="" drillDownDataSource="" width="200" height="200" sidebarContent="" showSidebar="false" sidebarWidth="" maximized="false" homeRowL="0" homeColL="0" colSpanL="4" rowSpanL="4" showToolbar="true" showToolbarBottomBorder="true" showToolbarOnlyWhenMaximized="false" colorToolbar="#F0F0F0" opacityToolbar="1" backgroundColor="#F0F0F0" opacity="1" theme="" dataColorList="">
<control name="" action="applyFilter" target="*" targetProperty="[HomeD].[H1].[ZIP Code]" location="dashboard" type="auto" controlClass="" label="ZIP Code" title="" value="&[32007]" text="32007" readOnly="false" valueList="" displayList="" activeWhen="">
<valueRequired>false</valueRequired>
</control>
<control name="" action="applyFilter" target="*" targetProperty="[AllerD].[H1].[Allergies]" location="dashboard" type="auto" controlClass="" label="Allergies" title="" value="&[soy]" text="soy" readOnly="false" valueList="" displayList="" activeWhen="">
<valueRequired>false</valueRequired>
</control>
<control name="" action="applyFilter" target="*" targetProperty="[ColorD].[H1].[Favorite Color]" location="dashboard" type="auto" controlClass="" label="Favorite Color" title="" value="&[Blue]" text="Blue" readOnly="false" valueList="" displayList="" activeWhen="">
<valueRequired>false</valueRequired>
</control>
</widget>
<widget name="ウィジェット2" type="pivot" subtype="pivot" subtypeClass="lineChart" title="" dataSource="Tutorial/Patients by Diagnosis.pivot" dataLink="" drillDownDataSource="" width="200" height="200" sidebarContent="" showSidebar="false" sidebarWidth="" maximized="false" homeRowL="4" homeColL="0" colSpanL="4" rowSpanL="4" showToolbar="true" showToolbarBottomBorder="true" showToolbarOnlyWhenMaximized="false" colorToolbar="#F0F0F0" opacityToolbar="1" backgroundColor="#F0F0F0" opacity="1" theme="" dataColorList="">
</widget>
</dashboard>
<pivot xmlns="http://www.intersystems.com/deepsee/library" name="Patients by Age Group" folderName="Tutorial" title="" description="" keywords="" owner="" shared="true" public="false" locked="false" resource="" timeCreated="2024-05-07T00:24:12.814Z" createdBy="_SYSTEM" category="" bookCover="" lastAccessed="2024-05-07T00:24:36Z" mdx="" cellWidth="120" columnHeaderStyle="" rowHeaderStyle="" cellStyle="" rowLabelSpan="true" columnLabelSpan="true" cellHeight="22" showEmptyRows="false" showEmptyColumns="false" cubeName="TUTORIAL" caption="" listing="" listingRows="" showStatus="true" canDrillDown="true" pageSize="100" colorScale="" rowTotals="false" columnTotals="false" rowTotalAgg="sum" columnTotalAgg="sum" rowTotalSource="page" showZebra="false" showRowCaption="true" printTitle="" printSubtitle="" printSubtitleOn="" showUser="" printPageSize="" printOrientation="1" printMarginTop="" printMarginLeft="" printMarginRight="" printMarginBottom="" printLabelWidth="" printCellWidth="" autoExecute="true" previewMode="false" manualMode="false" userMDX="" chartMarginTop="" chartMarginLeft="" chartMarginRight="" chartMarginBottom="" maxRows="" borderLeftCell="" borderRightCell="" borderTopCell="" borderBottomCell="" borderLeftCol="" borderRightCol="" borderTopCol="" borderBottomCol="" borderLeftRow="" borderRightRow="" borderTopRow="" borderBottomRow="" fontFamilyCell="" fontSizeCell="" fontFamilyCol="" fontSizeCol="" fontFamilyRow="" fontSizeRow="" showFilters="" showListingFilters="" showDate="" listingFontSize="" showZebraStripes="" filterTableStyle="" filterTableCaptionStyle="" filterTableItemStyle="" nowDisplayFormat="" measureLocation="columns" hideMeasures="1" backgroundImage="" backgroundOpacity=".12">
<rowAxisOptions spec="" key="" value="" text="" headEnabled="false" headCount="" filterEnabled="false" filterExpression="" orderEnabled="false" orderExpression="" orderDirection="BDESC" aggEnabled="false" aggFunction="" aggFunctionParm="" levelCaption="" levelFormat="" levelSummary="" levelType="" drillLevel="0" advanced="false" levelStyle="" levelHeaderStyle="" suppress8020="false" drilldownSpec="" enabled="true">
</rowAxisOptions>
<columnAxisOptions spec="" key="" value="" text="" headEnabled="false" headCount="" filterEnabled="false" filterExpression="" orderEnabled="false" orderExpression="" orderDirection="BDESC" aggEnabled="false" aggFunction="" aggFunctionParm="" levelCaption="" levelFormat="" levelSummary="" levelType="" drillLevel="0" advanced="false" levelStyle="" levelHeaderStyle="" suppress8020="false" drilldownSpec="" enabled="true">
</columnAxisOptions>
<rowLevel spec="[AgeD].[H1].[Age Group].Members" key="" value="" text="Age Group" headEnabled="false" headCount="" filterEnabled="false" filterExpression="" orderEnabled="false" orderExpression="" orderDirection="BDESC" aggEnabled="false" aggFunction="" aggFunctionParm="" levelCaption="" levelFormat="" levelSummary="" levelType="" drillLevel="0" advanced="false" levelStyle="" levelHeaderStyle="" suppress8020="false" drilldownSpec="" enabled="true">
<childLevels spec="[AgeD].[H1].[Age Bucket].Members" key="" value="" text="Age Bucket" headEnabled="false" headCount="" filterEnabled="false" filterExpression="" orderEnabled="false" orderExpression="" orderDirection="BDESC" aggEnabled="false" aggFunction="" aggFunctionParm="" levelCaption="" levelFormat="" levelSummary="" levelType="" drillLevel="0" advanced="false" levelStyle="" levelHeaderStyle="" suppress8020="false" drilldownSpec="" enabled="true">
</childLevels>
</rowLevel>
<rowLevel spec="[AgeD].[All Patients]" key="" value="" text="All Patients" headEnabled="false" headCount="" filterEnabled="false" filterExpression="" orderEnabled="false" orderExpression="" orderDirection="BDESC" aggEnabled="false" aggFunction="" aggFunctionParm="" levelCaption="" levelFormat="" levelSummary="" levelType="" drillLevel="0" advanced="false" levelStyle="" levelHeaderStyle="" suppress8020="false" drilldownSpec="" enabled="true">
</rowLevel>
<columnLevel spec="[Measures].[%COUNT]" key="" value="" text="Count" headEnabled="false" headCount="" filterEnabled="false" filterExpression="" orderEnabled="false" orderExpression="" orderDirection="BDESC" aggEnabled="false" aggFunction="" aggFunctionParm="" levelCaption="" levelFormat="" levelSummary="" levelType="" drillLevel="0" advanced="false" levelStyle="" levelHeaderStyle="" suppress8020="false" drilldownSpec="" enabled="true">
</columnLevel>
<sqlRestriction></sqlRestriction>
</pivot>
<pivot xmlns="http://www.intersystems.com/deepsee/library" name="Patients by Diagnosis" folderName="Tutorial" title="" description="" keywords="" owner="" shared="true" public="false" locked="false" resource="" timeCreated="2024-05-07T00:29:52.151Z" createdBy="_SYSTEM" category="" bookCover="" lastAccessed="2024-05-07T00:29:54Z" mdx="" cellWidth="120" columnHeaderStyle="" rowHeaderStyle="" cellStyle="" rowLabelSpan="true" columnLabelSpan="true" cellHeight="22" showEmptyRows="false" showEmptyColumns="false" cubeName="TUTORIAL" caption="" listing="" listingRows="" showStatus="true" canDrillDown="true" pageSize="100" colorScale="" rowTotals="false" columnTotals="false" rowTotalAgg="sum" columnTotalAgg="sum" rowTotalSource="page" showZebra="false" showRowCaption="true" printTitle="" printSubtitle="" printSubtitleOn="" showUser="" printPageSize="" printOrientation="1" printMarginTop="" printMarginLeft="" printMarginRight="" printMarginBottom="" printLabelWidth="" printCellWidth="" autoExecute="true" previewMode="false" manualMode="false" userMDX="" chartMarginTop="" chartMarginLeft="" chartMarginRight="" chartMarginBottom="" maxRows="" borderLeftCell="" borderRightCell="" borderTopCell="" borderBottomCell="" borderLeftCol="" borderRightCol="" borderTopCol="" borderBottomCol="" borderLeftRow="" borderRightRow="" borderTopRow="" borderBottomRow="" fontFamilyCell="" fontSizeCell="" fontFamilyCol="" fontSizeCol="" fontFamilyRow="" fontSizeRow="" showFilters="" showListingFilters="" showDate="" listingFontSize="" showZebraStripes="" filterTableStyle="" filterTableCaptionStyle="" filterTableItemStyle="" nowDisplayFormat="" measureLocation="columns" hideMeasures="1" backgroundImage="" backgroundOpacity=".12">
<rowAxisOptions spec="" key="" value="" text="" headEnabled="false" headCount="" filterEnabled="false" filterExpression="" orderEnabled="false" orderExpression="" orderDirection="BDESC" aggEnabled="false" aggFunction="" aggFunctionParm="" levelCaption="" levelFormat="" levelSummary="" levelType="" drillLevel="0" advanced="false" levelStyle="" levelHeaderStyle="" suppress8020="false" drilldownSpec="" enabled="true">
</rowAxisOptions>
<columnAxisOptions spec="" key="" value="" text="" headEnabled="false" headCount="" filterEnabled="false" filterExpression="" orderEnabled="false" orderExpression="" orderDirection="BDESC" aggEnabled="false" aggFunction="" aggFunctionParm="" levelCaption="" levelFormat="" levelSummary="" levelType="" drillLevel="0" advanced="false" levelStyle="" levelHeaderStyle="" suppress8020="false" drilldownSpec="" enabled="true">
</columnAxisOptions>
<rowLevel spec="[DiagD].[H1].[Diagnoses].Members" key="" value="" text="Diagnoses" headEnabled="false" headCount="" filterEnabled="false" filterExpression="" orderEnabled="false" orderExpression="" orderDirection="BDESC" aggEnabled="false" aggFunction="" aggFunctionParm="" levelCaption="" levelFormat="" levelSummary="" levelType="" drillLevel="0" advanced="false" levelStyle="" levelHeaderStyle="" suppress8020="false" drilldownSpec="" enabled="true">
</rowLevel>
<columnLevel spec="[Measures].[%COUNT]" key="" value="" text="Count" headEnabled="false" headCount="" filterEnabled="false" filterExpression="" orderEnabled="false" orderExpression="" orderDirection="BDESC" aggEnabled="false" aggFunction="" aggFunctionParm="" levelCaption="" levelFormat="" levelSummary="" levelType="" drillLevel="0" advanced="false" levelStyle="" levelHeaderStyle="" suppress8020="false" drilldownSpec="" enabled="true">
</columnLevel>
<columnLevel spec="[Measures].[Avg Age]" key="" value="" text="Avg Age" headEnabled="false" headCount="" filterEnabled="false" filterExpression="" orderEnabled="false" orderExpression="" orderDirection="BDESC" aggEnabled="false" aggFunction="" aggFunctionParm="" levelCaption="" levelFormat="" levelSummary="" levelType="" drillLevel="0" advanced="false" levelStyle="" levelHeaderStyle="" suppress8020="false" drilldownSpec="" enabled="true">
</columnLevel>
<sqlRestriction></sqlRestriction>
</pivot>
</items>
}
}
では、フォルダマネージャ画面に戻り、ページをリロードして更新します。先ほど付けたチェックマークがリセットされます。
リストから、先ほどの3つのアイテムを再びチェックし、画面左側の [削除] ボタンを押してこれらを削除します。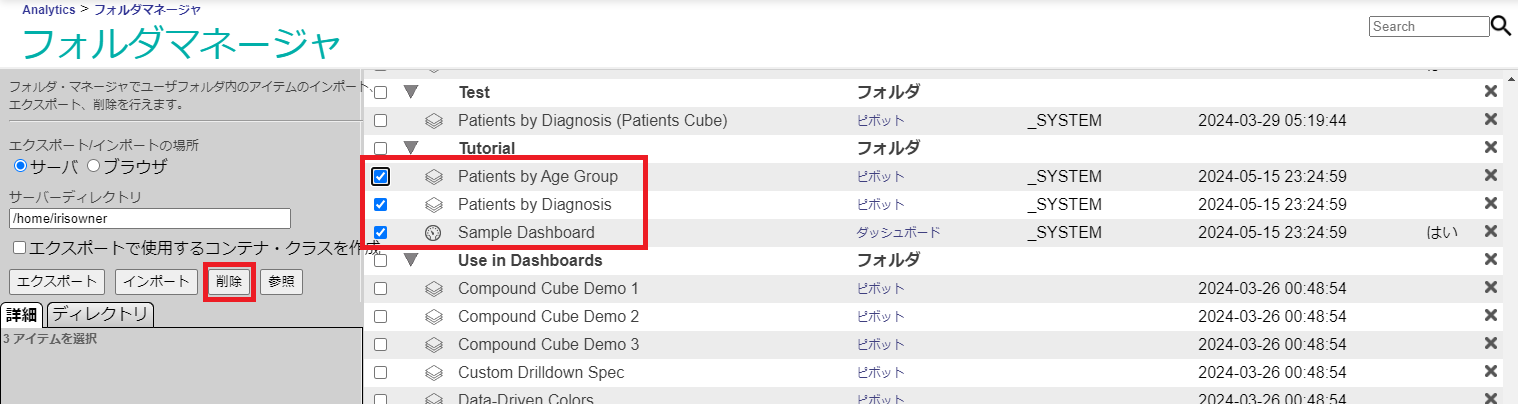
確認のダイアログが表示されますので、[OK] で進めます。なにかを削除するのは、いつも不安になりますが。。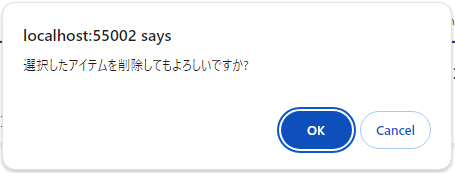
「3アイテムを削除しました」とのメッセージが返ってきました。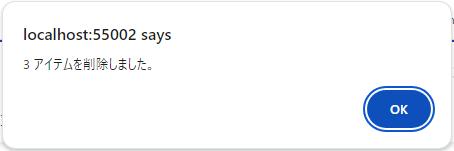
画面がリフレッシュされ、リストには Tutorial フォルダだけが残り、3つのアイテムは削除されました。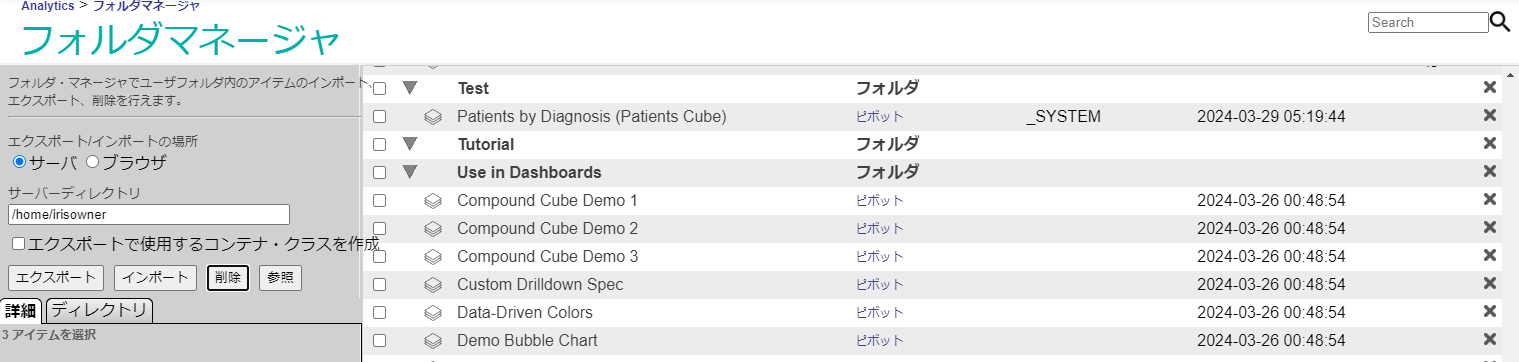 では、先ほどのクラス定義に戻り、保存していたクラス定義をコンパイルします。
うまくいけば、以下のようにコンパイルの成功と、3つのアイテムのインポートのログが出てくるかと思います。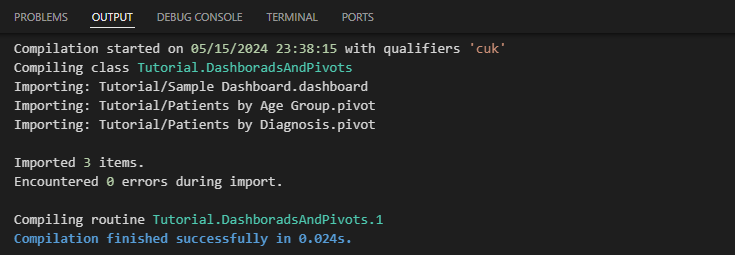
では、フォルダマネージャ画面に戻り、画面をリフレッシュします。
そうしますと Tutorial フォルダには、削除した3つのアイテムが戻っています。よかった!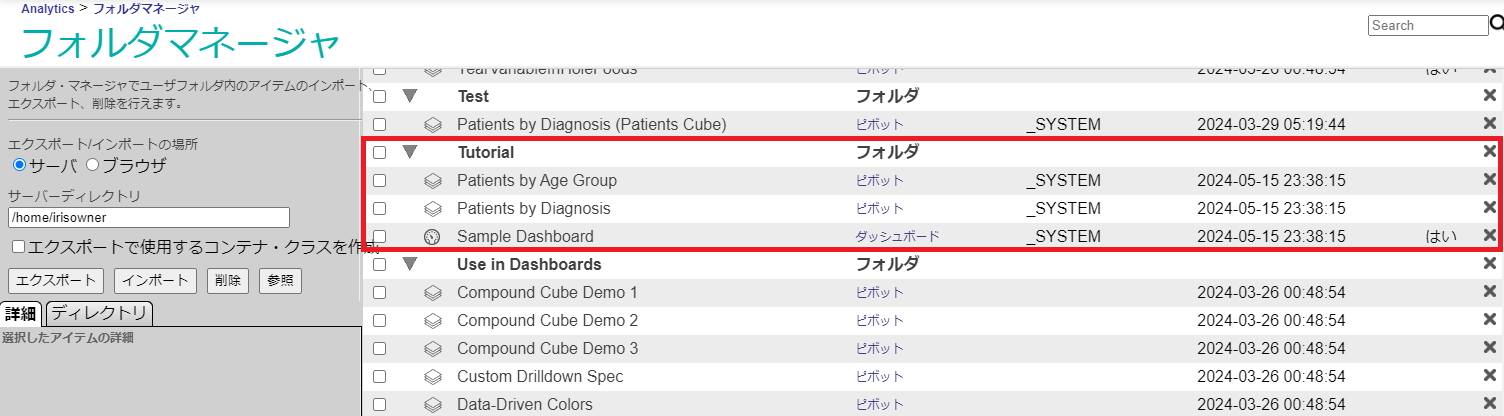
おわりに
今回はピボットテーブルやダッシュボードのインポート・エクスポートと、それらをパッケージ化するクラスの作成方法について学びました。
これでIRIS BIの開発者向けチュートリアルのすべての内容を実施しました。全部で11回と、思った以上に長丁場になってしまいましたが。。
チュートリアルの内容は、IRIS BIを利用するに際しての基本的な知識や作業が網羅されておりますので、このシリーズを通すことでIRIS BIに対する理解が深まったり、開発作業などにおける疑問の解消につながればよいなと思っております。
最後までお付き合いいただきまして、ありがとうございました!