También en versiones anteriores podíais definir vuestro servidor FHIR para aceptar solicitudes mediante OAuth 2.0 (por ejemplo, para un cliente SMART on FHIR), pero hoy en día, con la versión v2024.3, que se lanzó hace ya un tiempo, existe una nueva funcionalidad que permite hacerlo de forma más sencilla: el OAuth FHIR Client QuickStart.
.png)
.png)
Este “QuickStart” es un asistente tipo wizard que os permite conectar vuestro servidor FHIR a un servidor OAuth y habilitar la autenticación y autorización OAuth para las solicitudes FHIR en 5 sencillos pasos (en realidad, solo 3…).
- Paso 1 – Crear o elegir un servidor FHIR
.png)
Puede que ya tengáis un servidor FHIR (endpoint) definido, o puede que todavía no hayáis definido ninguno y queráis hacerlo ahora como parte de este QuickStart.
- Paso 2 – Seleccionar servidor FHIR
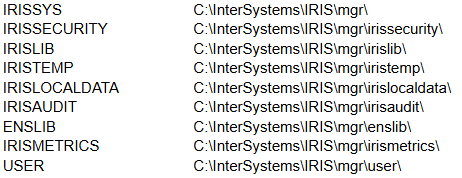
Si elegisteis “Usar uno existente”, se os mostrarán los endpoints disponibles por namespace. Por ejemplo:
.png)
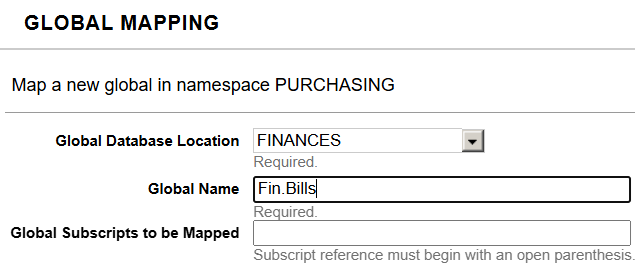
Si elegís “Crear nuevo”, se os mostrará un pequeño formulario para crear un nuevo endpoint.
Esto es similar a lo que veríais si crearais el endpoint previamente por vuestra cuenta:
.png)
- Paso 3 – Seleccionar el tipo de servidor OAuth
.png)
Podéis elegir usar un servidor OAuth externo (por ejemplo, Auth0 de Okta) o utilizar el servidor OAuth integrado en InterSystems IRIS.
Si queréis usar IRIS como vuestro servidor OAuth, necesitaréis configurar IRIS como un servidor OAuth que soporte FHIR. También disponéis de un “atajo” para ello: un método que podéis llamar y que realizará esta configuración por vosotros.
Tened en cuenta que es necesario configurar la comunicación segura para que esto funcione.
- Paso 4 – Configurar el servidor OAuth
Si elegisteis usar un servidor OAuth externo, se os pedirá que indiquéis su Issuer Endpoint:
.png)
Si ya habíais definido uno, podéis seleccionarlo del desplegable; si no, podéis escribirlo (o pegarlo).
En cualquier caso, podéis probar este endpoint del servidor OAuth, por ejemplo:
.png)
- Paso 5 (o 4 si elegisteis el servidor OAuth interno de IRIS) – Confirmar
Veréis una breve información de confirmación y un botón “Confirmar”.
Por ejemplo (al elegir crear un nuevo servidor FHIR y usar el servidor OAuth interno de IRIS):
.png)
O por ejemplo (al elegir un endpoint FHIR existente y un servidor OAuth externo):
.png)
Si todo va bien, veréis un mensaje indicando que se creó correctamente.
Si no, recibiréis un mensaje adecuado.
Entre bastidores, deberíais poder observar algunas cosas:
- Veréis el cliente definido dentro de los clientes OAuth (con sus detalles):
.png)
- Veréis el cliente definido en vuestro endpoint FHIR:
.png)
- En la sección general de Seguridad del Management Portal, bajo OAuth 2.0, también podréis encontrar una Definición de Cliente con su Configuración de Cliente.
Suponiendo que todo lo anterior funcione, podéis comenzar a usar OAuth (y específicamente SMART on FHIR) para comunicaros con vuestro servidor FHIR.
Más sobre esto… en un artículo futuro…
.png)
.png)
.png)